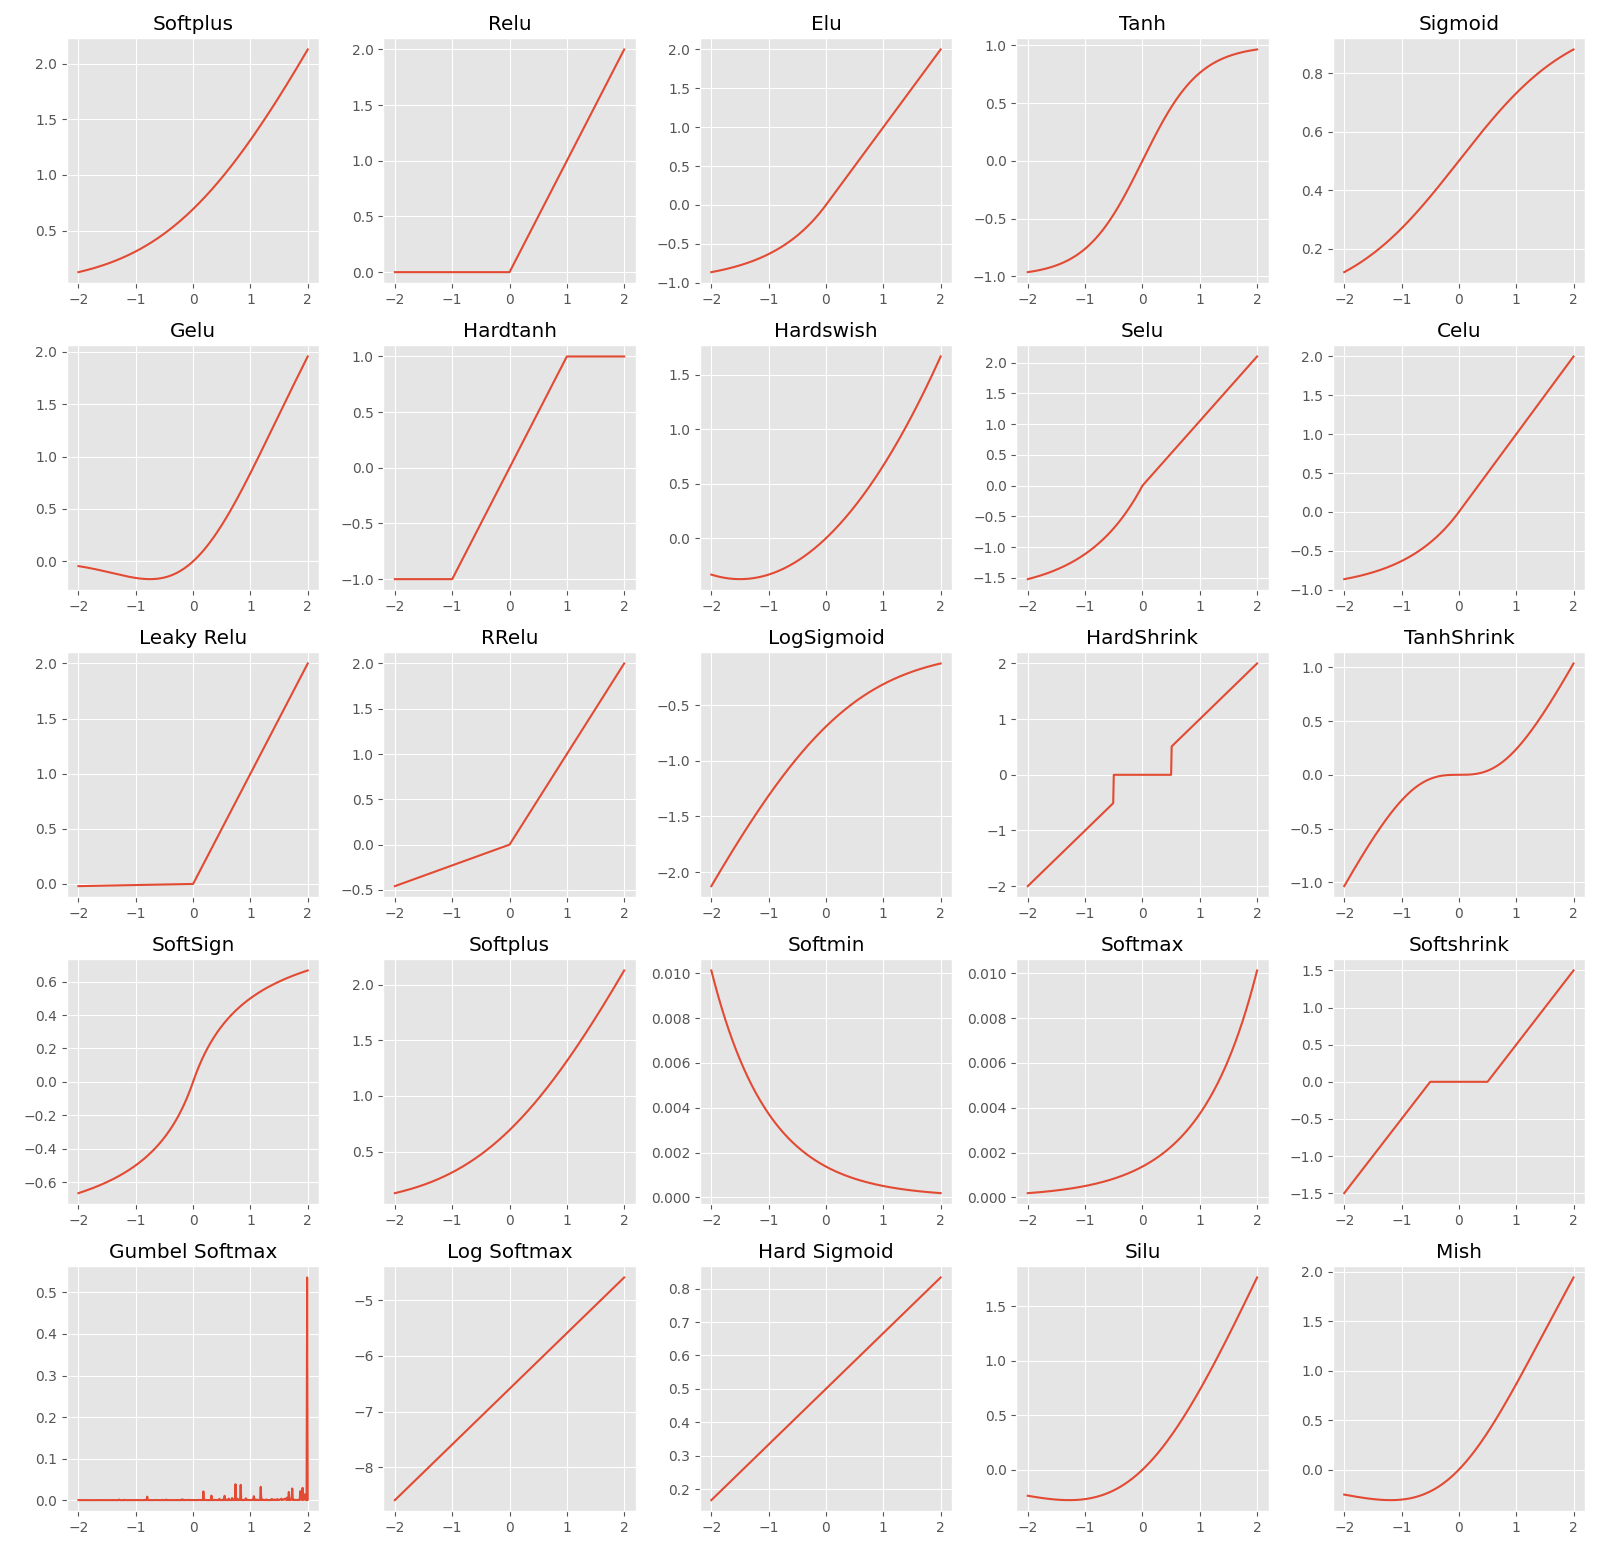
Visualize Activation Function avilable to use in Pytorch
Use of Activation Function
Deep Learning models by default are linear activated functions which limits them to leaning linear patterns. But most patterns in general tasks we train models are non-linear functions mostly including Softmax, ReLU, Sigmoid or Tanh. Non-Linear activation functions allow to preform more complex Non-Linear tasks by adding Complexity in neural network training layers.
Purpose of Activation Functions:
- Non-Linearity : Most real-world patterns are non-linear, so adding appropiate activation layer in between neural layers and final layer can achieve better results. Spend some time understanding the final output pattern and which layers fit best in your use case.
- Weight Boundary : Activation Functions keep the weights of neural network in check limiting them to explode during the time of training. They also help with issue like vanishing gradient.
- Output Range : Final Activation Function can help to control range of output from neural network enabling the tasks such as Classification or Regression.
What they do?
Activation Layer takes the output from neural layer passing them through activation function them moving forward them to next layer for processing. This step is repeated for every layer adding non-linearity in models.
-
Linear Transformation: For a given layer in a neural network, the output before applying the activation function is computed as:
z = W.x + b
Where:
- z is the output of the linear transformation (pre-activation).
- W is the weight matrix of the layer.
- x is the input vector (from the previous layer or input data).
- b is the bias vector.
-
Activation Function Application:
After computing the linear transformation, the activation function f is applied to the output z :
a = f(z)
Where:
- a is the activated output (post-activation).
- f(z) is the activation function applied to $ z $.
Plotting Various Activation Functions
To better Understand various activation functions, we have created all avilable activation functions provided by Pytorch.

Below is Code to reproduce similar Results
1
2
3
4
5
6
7
8
9
10
11
12
13
14
15
16
17
18
19
20
21
22
23
24
25
26
27
28
29
30
31
32

x = torch.range(-2,2,0.01) # X values for input
final_y = []
graph_x = 5 ; graph_y = 5 # Parameter for Graph
plt.figure(figsize=(16,graph_x*3.1)) # Figure Size
plt.subplot(graph_x,graph_y,1);y = torch.nn.functional.softplus(x);plt.title('Softplus');plt.plot(x.numpy() , y.numpy()); final_y.append(y);
plt.subplot(graph_x,graph_y,2);y = torch.nn.functional.relu(x);plt.title('Relu');plt.plot(x.numpy() , y.numpy()); final_y.append(y);
plt.subplot(graph_x,graph_y,3);y = torch.nn.functional.elu(x);plt.title('Elu');plt.plot(x.numpy() , y.numpy()); final_y.append(y);
plt.subplot(graph_x,graph_y,4);y = torch.nn.functional.tanh(x);plt.title('Tanh');plt.plot(x.numpy() , y.numpy()); final_y.append(y);
plt.subplot(graph_x,graph_y,5);y = torch.nn.functional.sigmoid(x);plt.title('Sigmoid');plt.plot(x.numpy() , y.numpy()); final_y.append(y);
plt.subplot(graph_x,graph_y,6);y = torch.nn.functional.gelu(x);plt.title('Gelu');plt.plot(x.numpy() , y.numpy()); final_y.append(y);
plt.subplot(graph_x,graph_y,7);y = torch.nn.functional.hardtanh(x);plt.title('Hardtanh');plt.plot(x.numpy() , y.numpy()); final_y.append(y);
plt.subplot(graph_x,graph_y,8);y = torch.nn.functional.hardswish(x);plt.title('Hardswish');plt.plot(x.numpy() , y.numpy()); final_y.append(y);
plt.subplot(graph_x,graph_y,9);y = torch.nn.functional.selu(x);plt.title('Selu');plt.plot(x.numpy() , y.numpy()); final_y.append(y);
plt.subplot(graph_x,graph_y,10);y = torch.nn.functional.celu(x);plt.title('Celu');plt.plot(x.numpy() , y.numpy()); final_y.append(y);
plt.subplot(graph_x,graph_y,11);y = torch.nn.functional.leaky_relu(x);plt.title('Leaky Relu');plt.plot(x.numpy() , y.numpy()); final_y.append(y);
plt.subplot(graph_x,graph_y,12);y = torch.nn.functional.rrelu(x);plt.title('RRelu');plt.plot(x.numpy() , y.numpy()); final_y.append(y);
plt.subplot(graph_x,graph_y,13);y = torch.nn.functional.logsigmoid(x);plt.title('LogSigmoid');plt.plot(x.numpy() , y.numpy()); final_y.append(y);
plt.subplot(graph_x,graph_y,14);y = torch.nn.functional.hardshrink(x);plt.title('HardShrink');plt.plot(x.numpy() , y.numpy()); final_y.append(y);
plt.subplot(graph_x,graph_y,15);y = torch.nn.functional.tanhshrink(x);plt.title('TanhShrink');plt.plot(x.numpy() , y.numpy()); final_y.append(y);
plt.subplot(graph_x,graph_y,16);y = torch.nn.functional.softsign(x);plt.title('SoftSign');plt.plot(x.numpy() , y.numpy()); final_y.append(y);
plt.subplot(graph_x,graph_y,17);y = torch.nn.functional.softplus(x);plt.title('Softplus');plt.plot(x.numpy() , y.numpy()); final_y.append(y);
plt.subplot(graph_x,graph_y,18);y = torch.nn.functional.softmin(x);plt.title('Softmin');plt.plot(x.numpy() , y.numpy()); final_y.append(y);
plt.subplot(graph_x,graph_y,19);y = torch.nn.functional.softmax(x);plt.title('Softmax');plt.plot(x.numpy() , y.numpy()); final_y.append(y);
plt.subplot(graph_x,graph_y,20);y = torch.nn.functional.softshrink(x);plt.title('Softshrink');plt.plot(x.numpy() , y.numpy()); final_y.append(y);
plt.subplot(graph_x,graph_y,21);y = torch.nn.functional.gumbel_softmax(x);plt.title('Gumbel Softmax');plt.plot(x.numpy() , y.numpy()); final_y.append(y);
plt.subplot(graph_x,graph_y,22);y = torch.nn.functional.log_softmax(x);plt.title('Log Softmax');plt.plot(x.numpy() , y.numpy()); final_y.append(y);
plt.subplot(graph_x,graph_y,23);y = torch.nn.functional.hardsigmoid(x);plt.title('Hard Sigmoid');plt.plot(x.numpy() , y.numpy()); final_y.append(y);
plt.subplot(graph_x,graph_y,24);y = torch.nn.functional.silu(x);plt.title('Silu');plt.plot(x.numpy() , y.numpy()); final_y.append(y);
plt.subplot(graph_x,graph_y,25);y = torch.nn.functional.mish(x);plt.title('Mish');plt.plot(x.numpy() , y.numpy()); final_y.append(y);
plt.tight_layout()
plt.savefig("Activation Functions.png")